Performance & Benchmarks
We benchmarked the optimiser across a wide range of event sizes - from 10 up to 300 tasks - to give you a realistic picture of how long planning takes and how well the results turn out. All tests used 30 staff members, 16 different skills, and a 15-hour day window (07:00 - 22:00) with task durations between 15 and 120 minutes. Every configuration was run 10 times to ensure reliable averages.
Test hardware
All timings were recorded on an Intel Core i7-1165G7 (Tiger Lake, 2.8 GHz base / 4.7 GHz boost) - a mid-range laptop processor. On a faster desktop or workstation CPU the solver will be noticeably quicker; on older or lower-power hardware it may take longer. The results are intended to give insight into how the optimiser scales - they are not a guarantee of runtime on any particular machine.
Across all 1,500 test runs, the optimiser found an optimal solution every single time - a 100% success rate regardless of event size or complexity.
How Fast Is It?
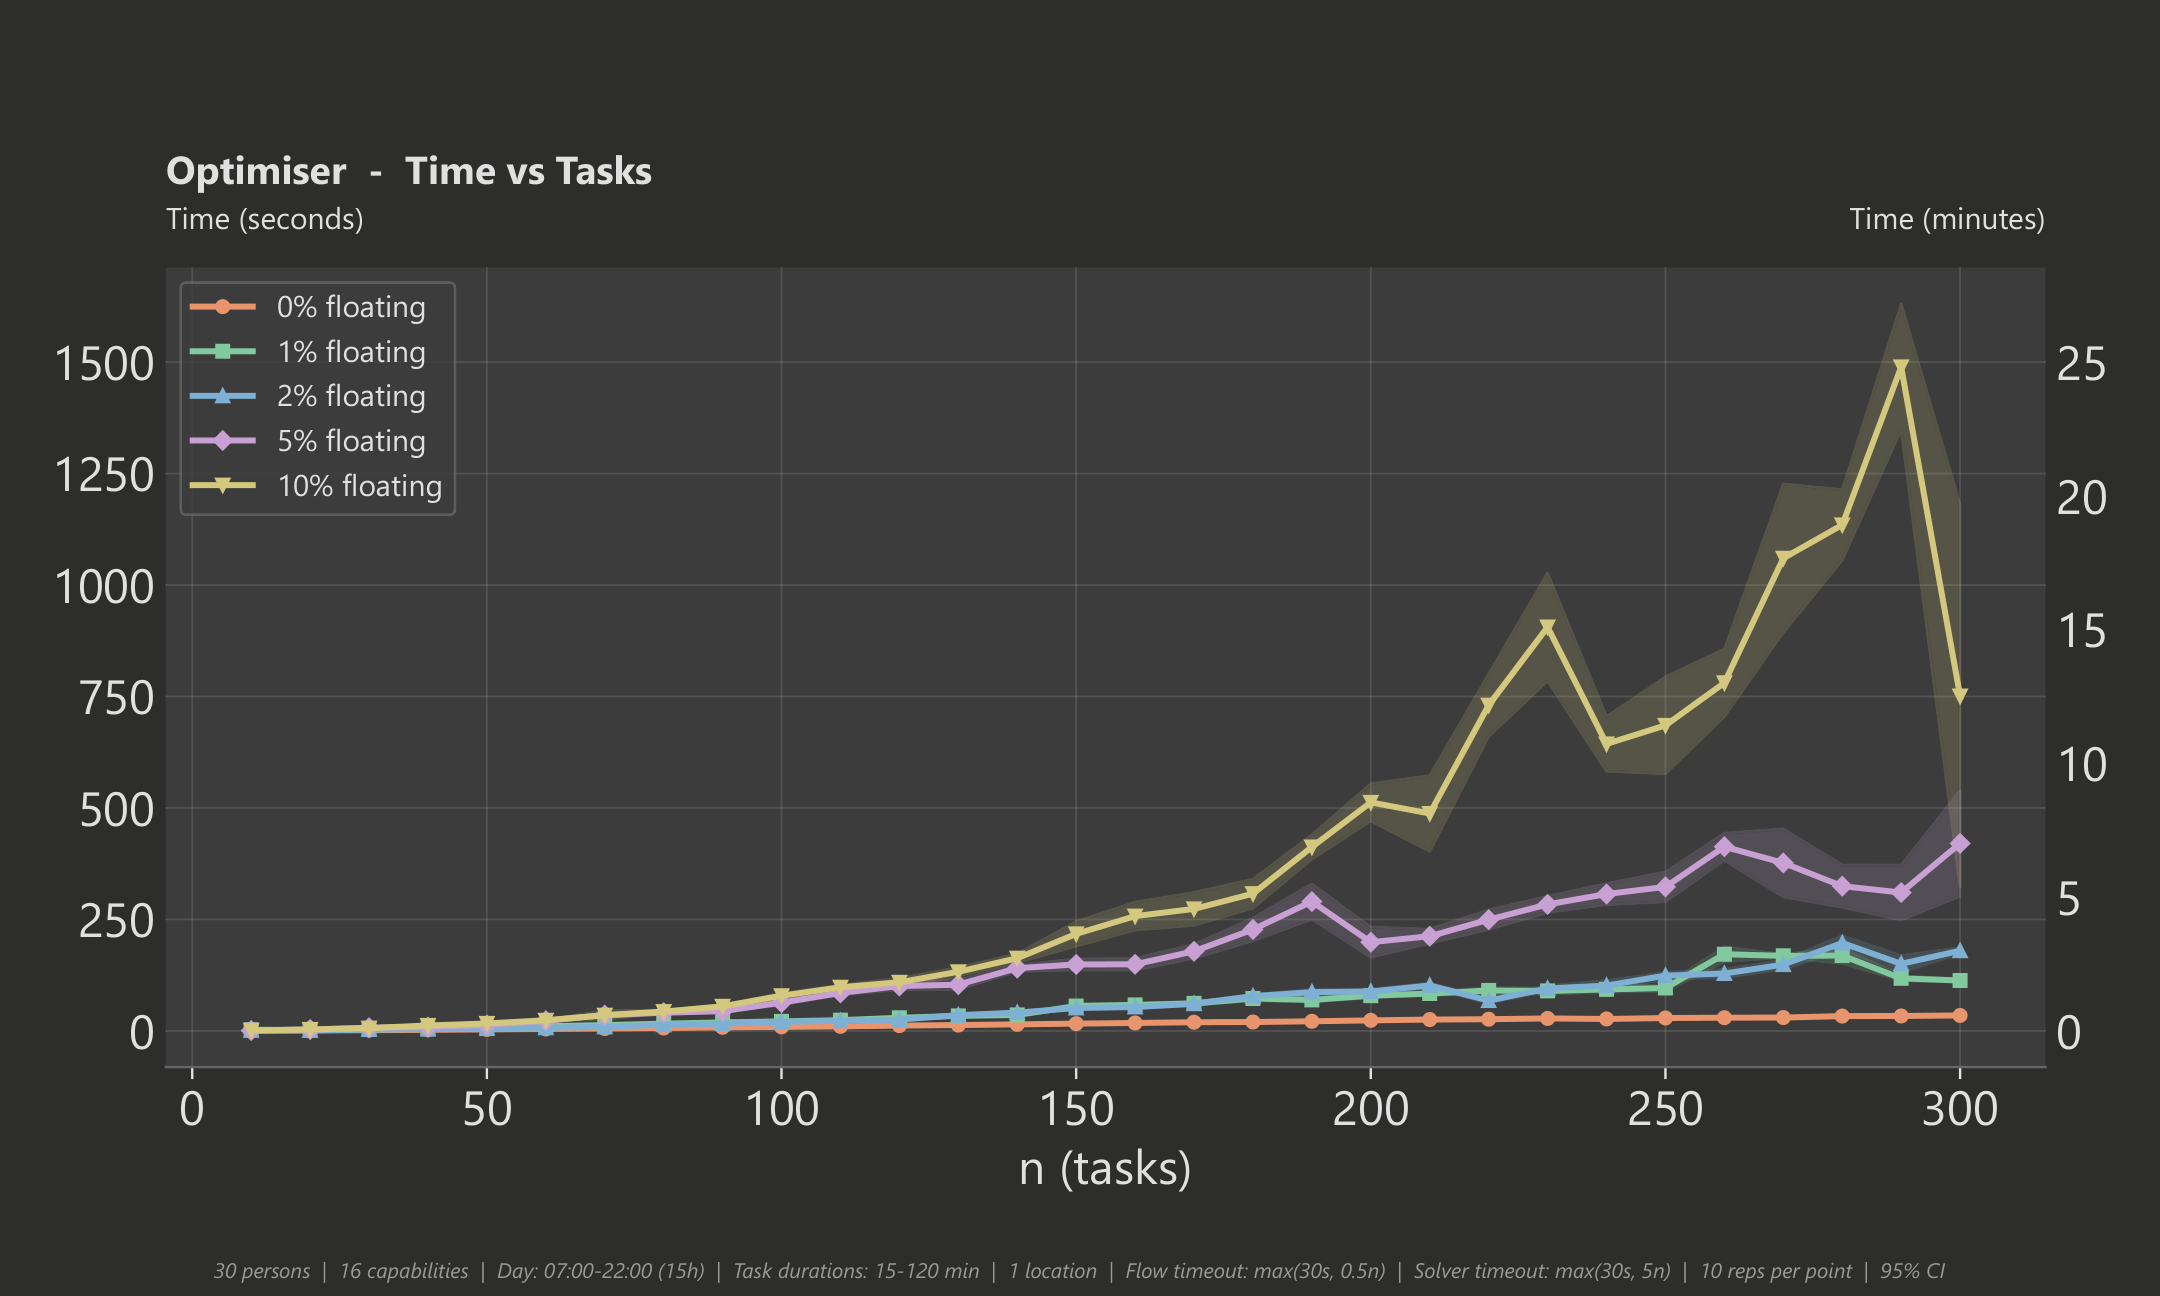
For a typical event without floating tasks (the most common scenario), the optimiser is very fast:
- Small event (50 tasks): roughly 5 seconds
- Medium event (100 tasks): roughly 13 seconds
- Large event (200 tasks): roughly 33 seconds
- Very large event (300 tasks): under 1 minute
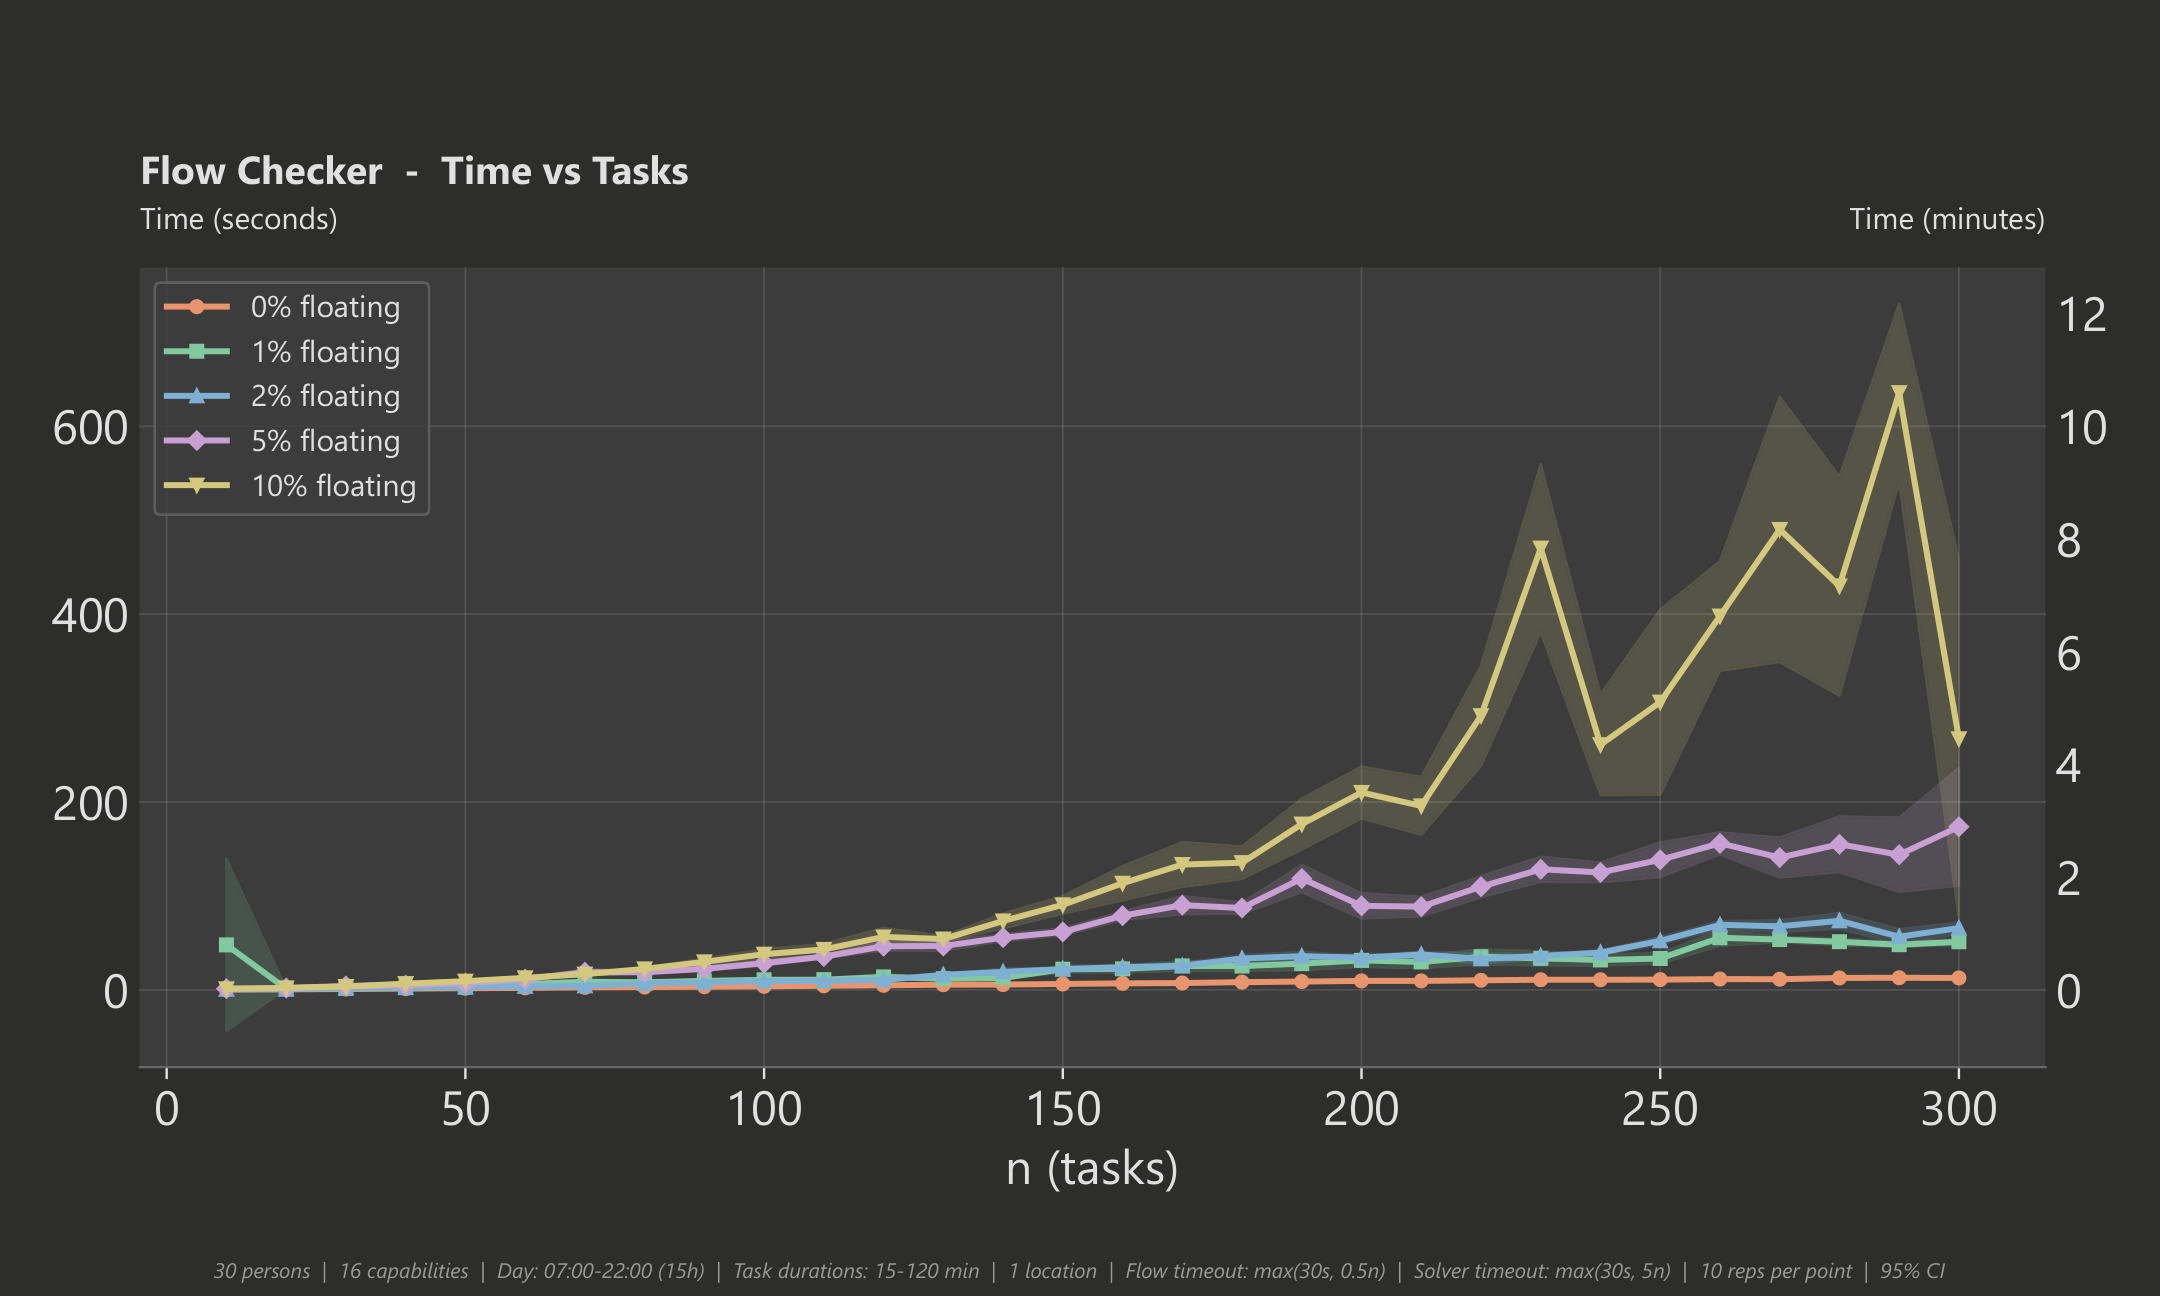
Adding floating tasks (tasks whose time is chosen by the optimiser) increases computation time because the solver has more decisions to make. With about 2% floating tasks, a 200-task event takes around 2 minutes. At 10% floating tasks - a fairly extreme scenario - a 200-task event takes around 12 minutes. In practice, most events have very few floating tasks, so you can expect fast results.
Fair Workload Distribution
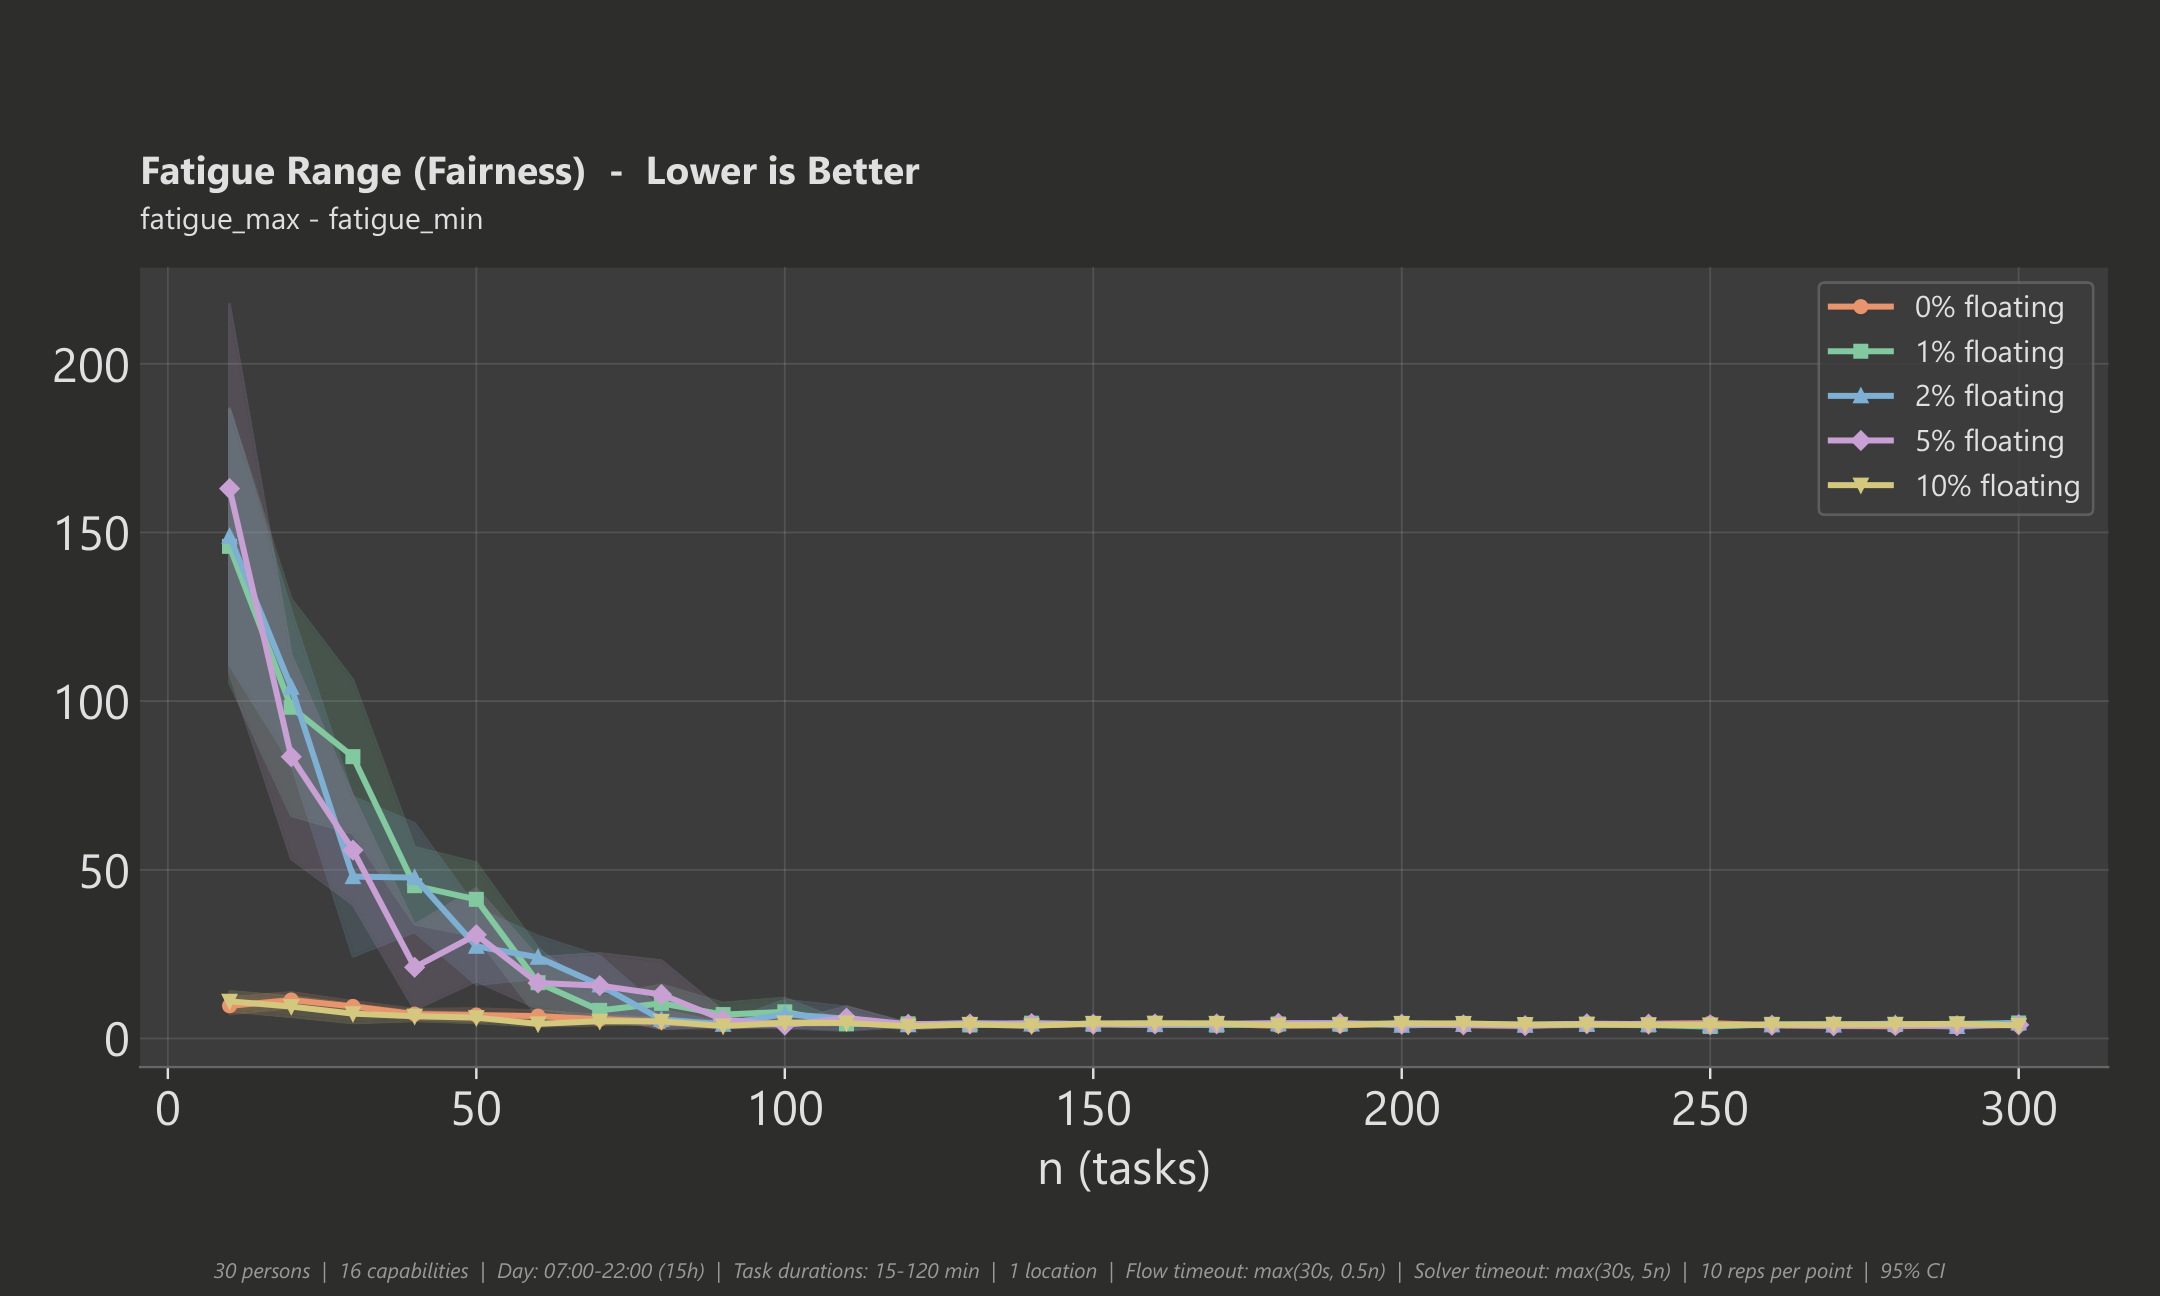
The optimiser doesn't just assign tasks quickly - it distributes them fairly. We measure fairness using the fatigue range: the difference in accumulated fatigue between the most and least loaded person. Fatigue is not simply working time - each task type carries its own fatigue-per-minute rate that you can customise, so a physically demanding task can be weighted to contribute more fatigue per minute than a lighter one. A smaller fatigue range means a more balanced schedule. In these benchmarks the fatigue rate is set to 1.0 for every task type, so the fatigue score equals the total working minutes - but in practice you can tune these rates to reflect real differences between task types.
Once your event has around 100 or more tasks, the fatigue range drops to roughly 4 - 5 fatigue points across all tested scenarios. That means even in large events, the overall strain is distributed very evenly across the team - a very fair result.
Workload Balance
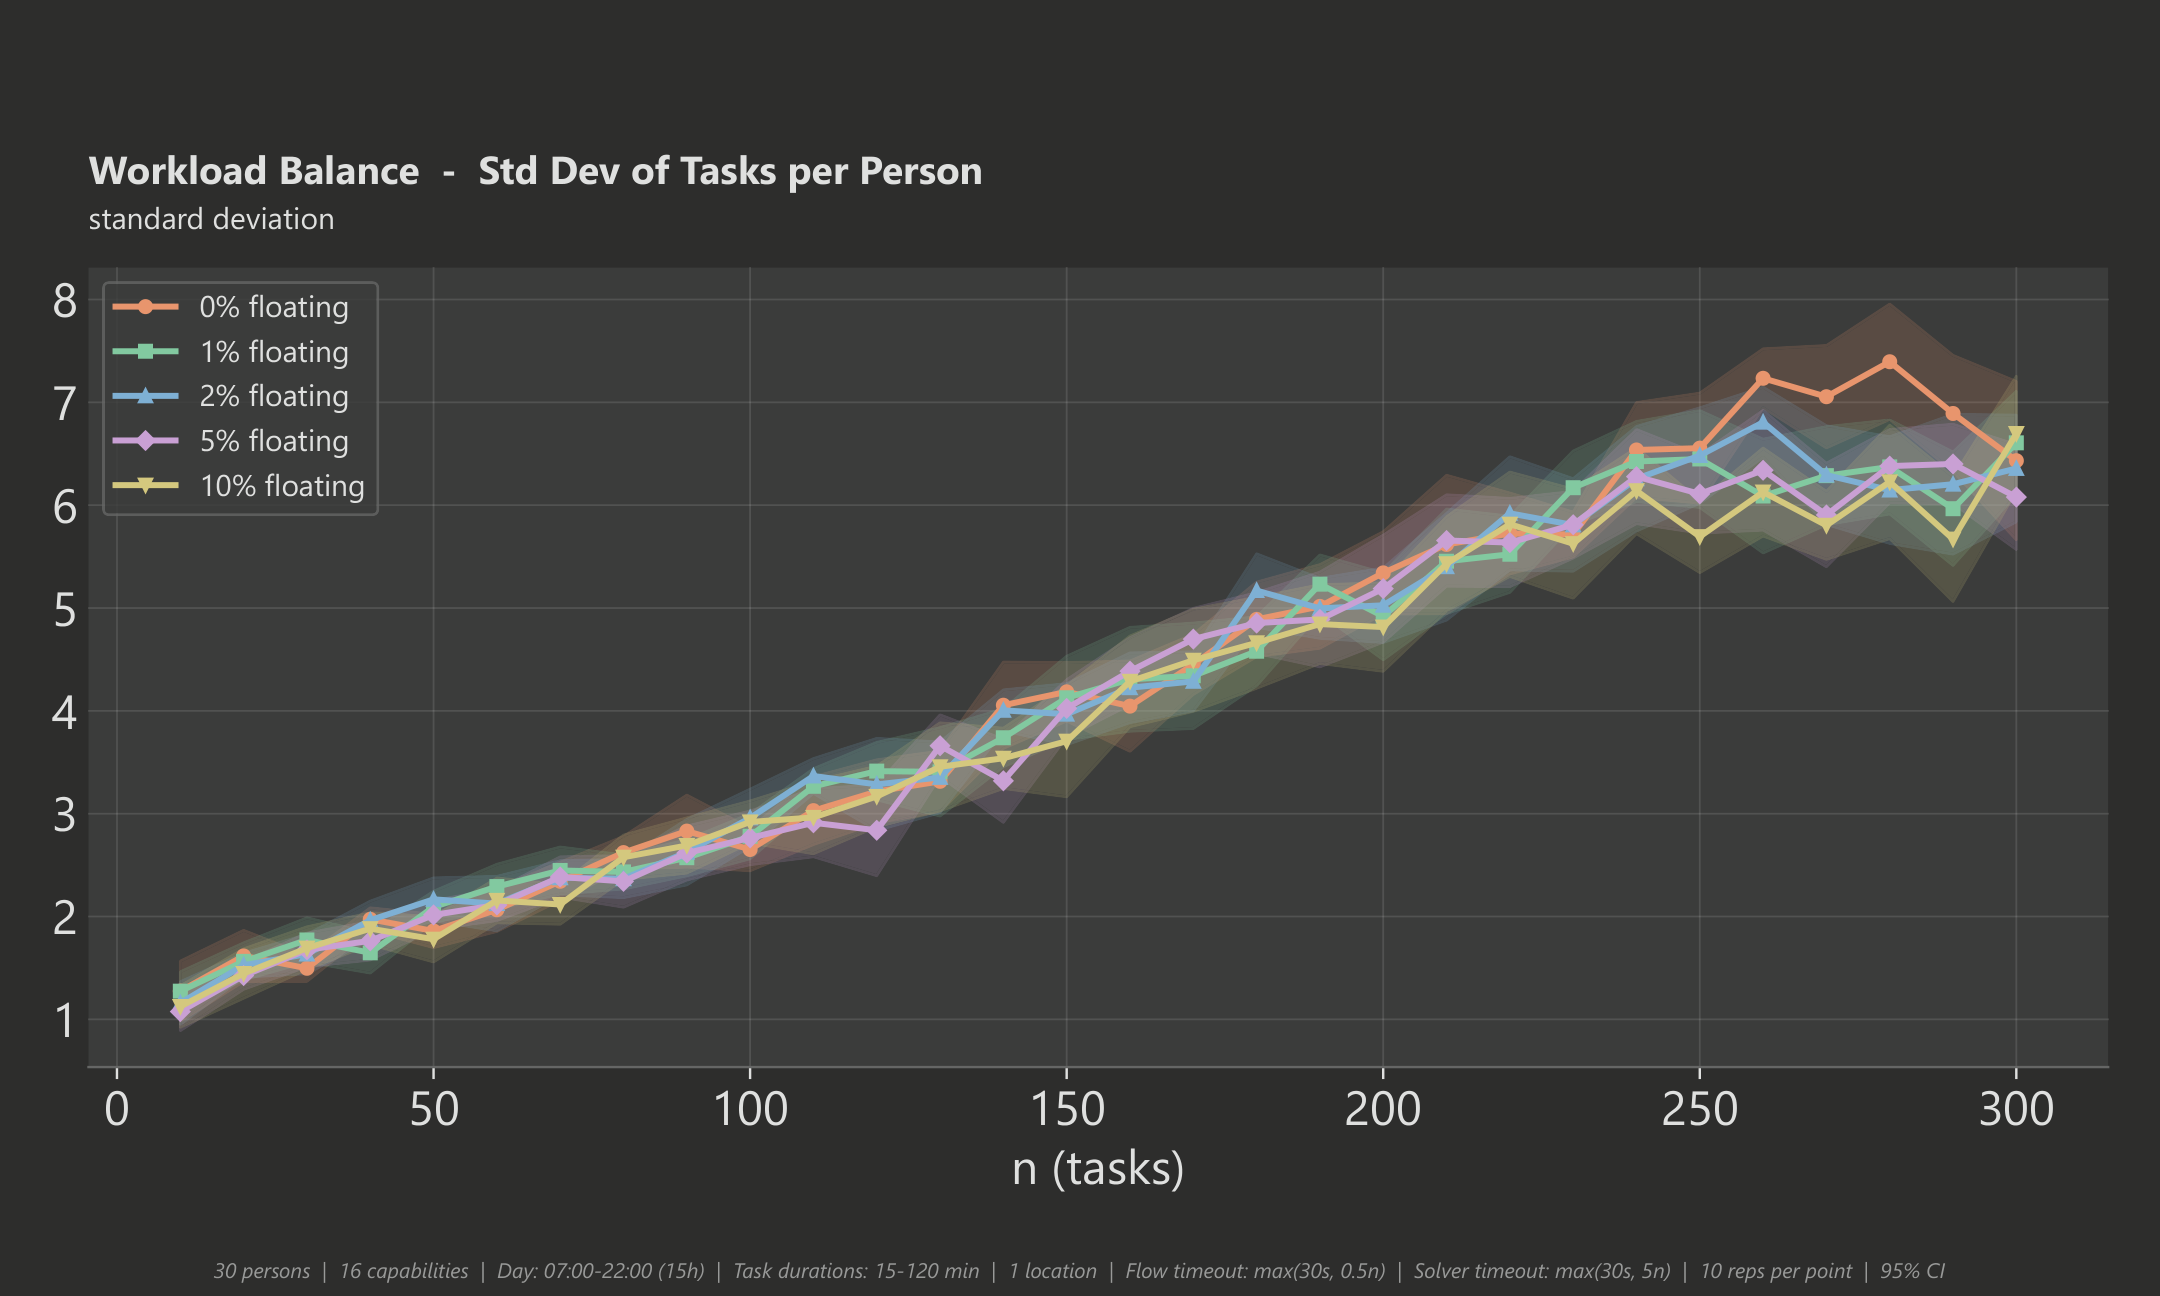
While the fatigue range measures how evenly strain is spread (taking task-type weighting into account), workload balance looks at something simpler: how evenly the number of tasks is distributed across the team. The chart below shows the standard deviation of task counts per person. In plain terms, if every person were assigned the exact same number of tasks the standard deviation would be zero; the further individual counts drift from the team average, the higher it gets.
Unlike the fatigue range, the standard deviation does not converge to a fixed low value as the event grows. The reason is that fatigue is the optimiser's primary objective - it actively minimises the gap between the most and least fatigued person - whereas the task count is only an indirect result. With more tasks in play, differences in task duration and skill requirements mean some people inevitably end up with a few more (shorter) or fewer (longer) tasks to keep their fatigue balanced. For example, at 300 tasks the average person handles about 10 tasks and the standard deviation is roughly 6 - most people are within a few tasks of the average, which is a well-balanced result given that fatigue fairness (the actual goal) is kept tight at the same time.
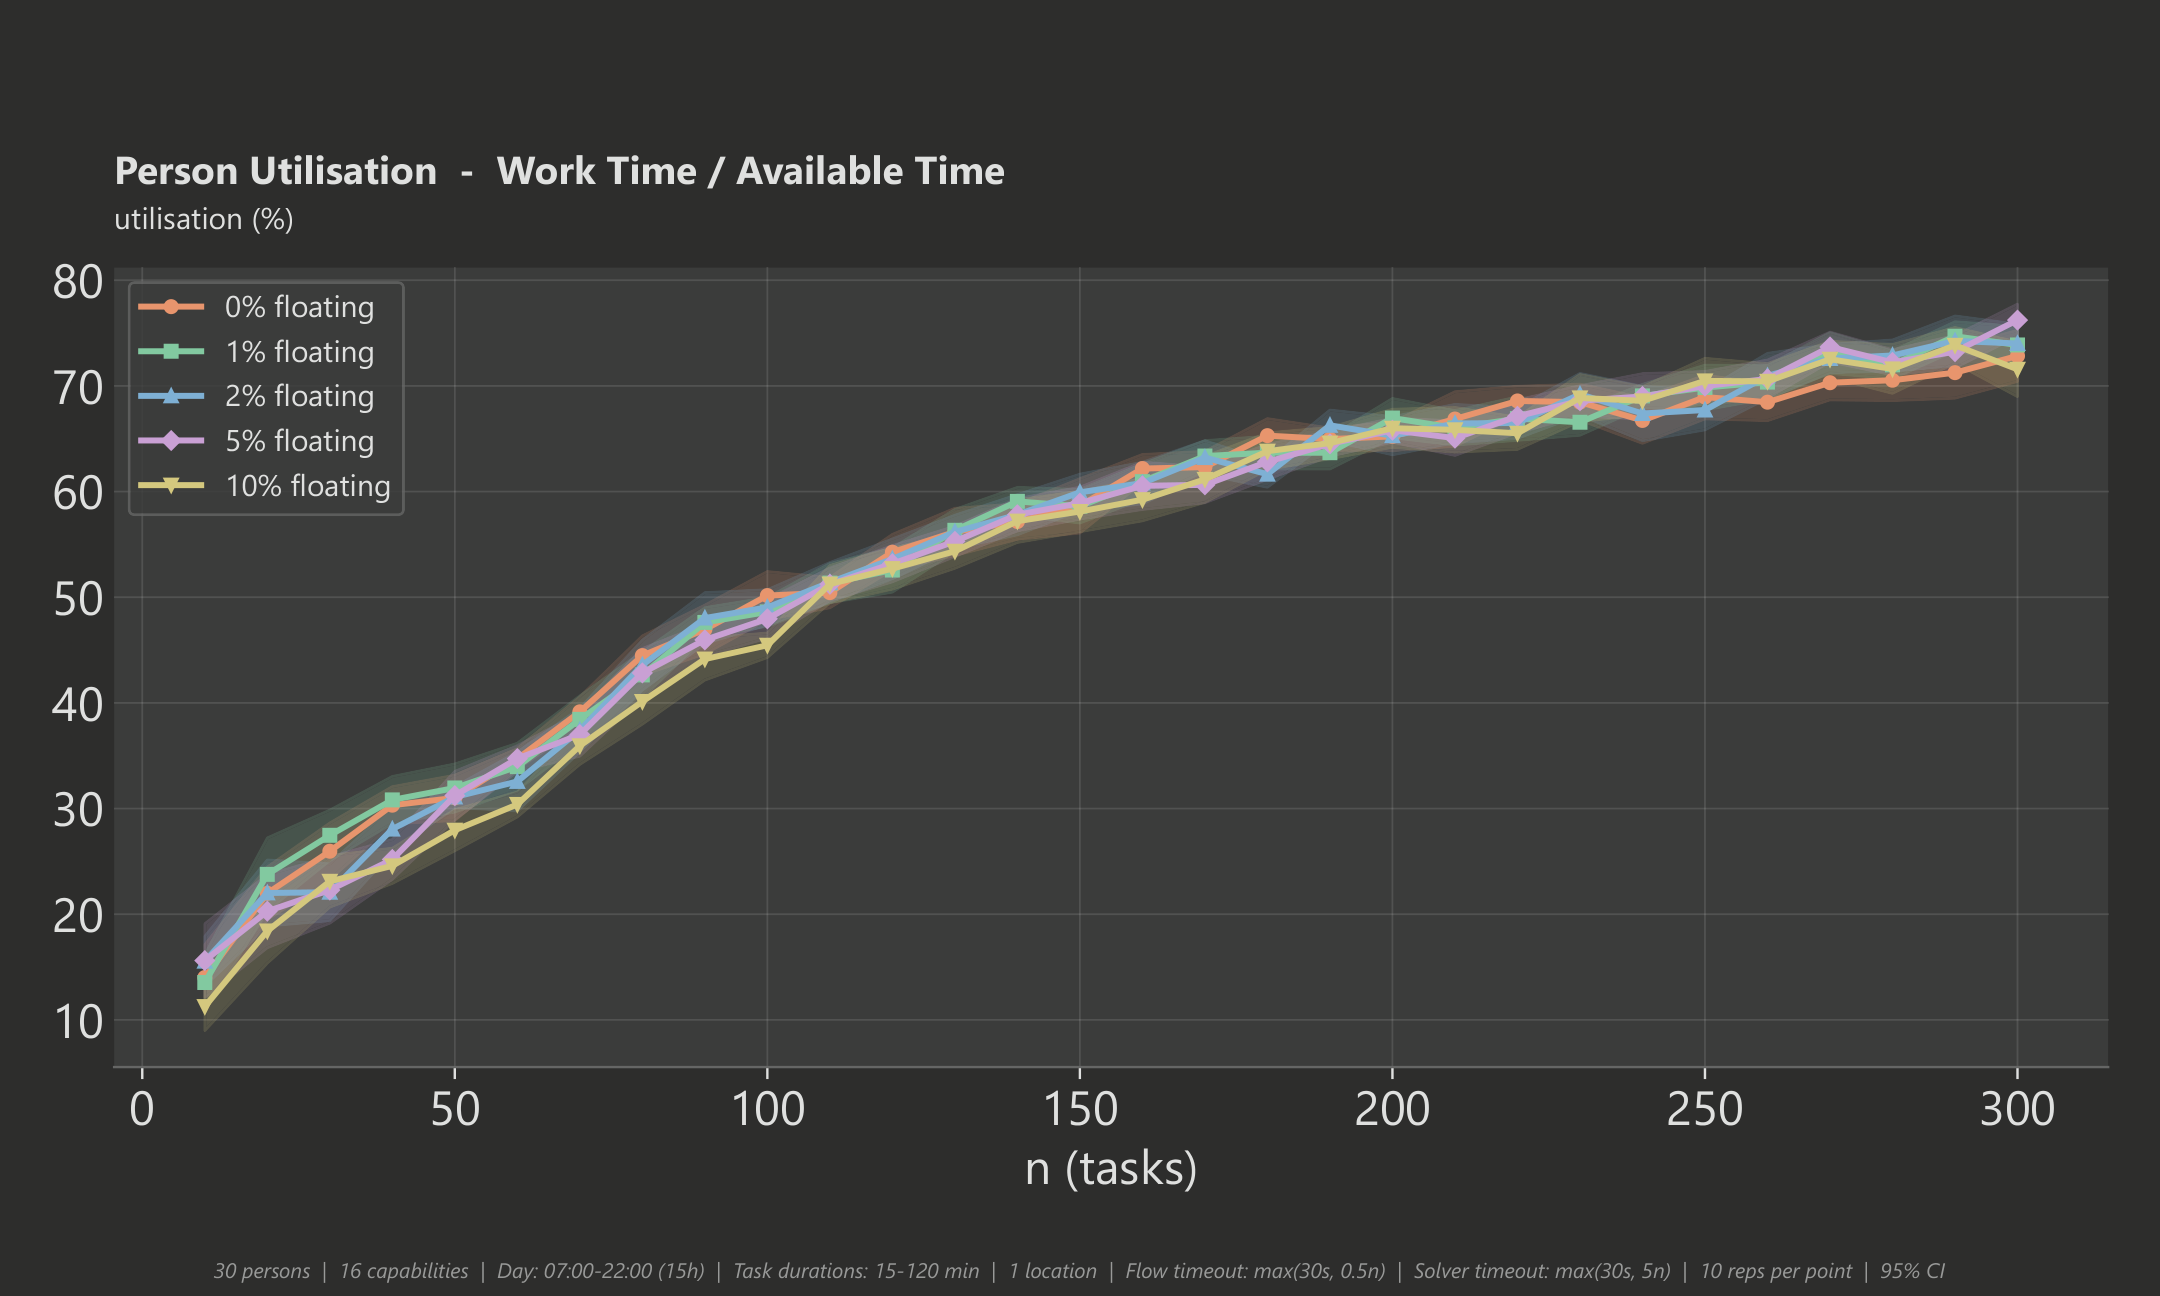
Staff Utilisation
The optimiser makes good use of your available team. For a small event (10 tasks) only about 14% of staff capacity is needed, while a large event with 200 tasks utilises roughly 65% and 300 tasks reaches about 73%. This means the optimiser scales smoothly and leaves enough room for breaks and buffer time even at high task counts.
Test Setup
All benchmarks were generated with randomised but realistic task sets. The shaded bands in the charts show the 95% confidence interval across 10 repetitions per data point.
- 30 persons, 16 capabilities
- Day window: 07:00 - 22:00 (15 hours)
- Task durations: 15 - 120 minutes
- Task counts: 10 - 300 (step 10)
- Floating-task percentages tested: 0%, 1%, 2%, 5%, 10%
- 10 repetitions per configuration
- Total runs: 1,500
- Success rate: 100% optimal solutions